Have a look at these 8 types of spreadsheets we do most often, think of these as potential components to the spreadsheet you may need, and then consider the possible solution we could make for you. But don’t limit yourself to these, as these are just the more common solutions we make.
- The Monitor of Entered Data
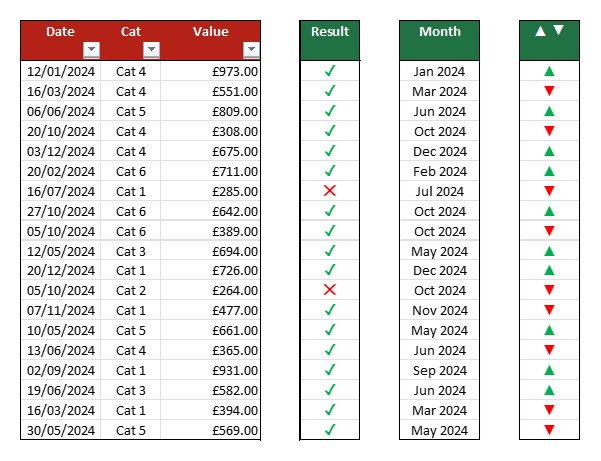
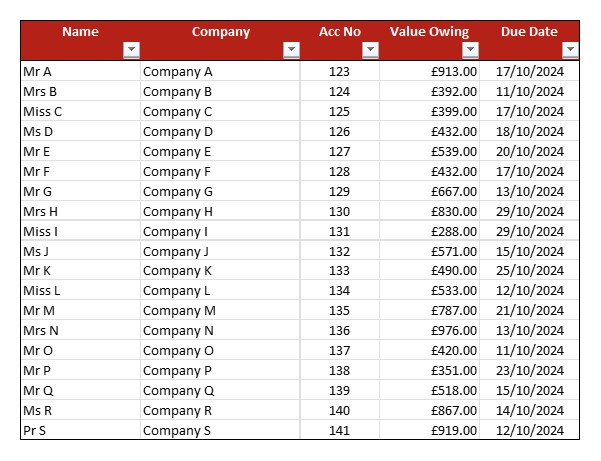
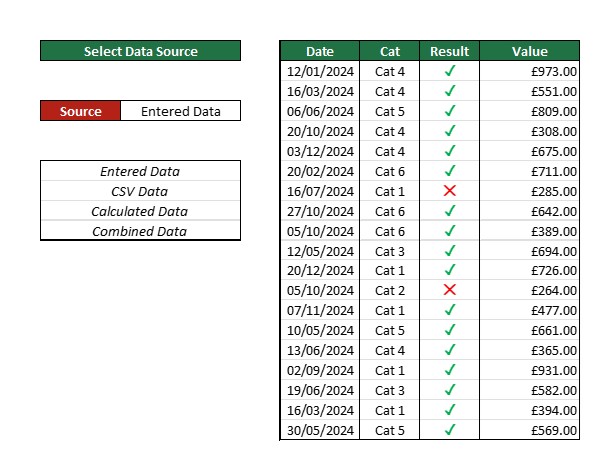
This is the classic spreadsheet where you have rows of data and collect various columns of information for each. These contain drop-down lists where possible, data validation to alert to missing or obviously incorrect data, and even predicted drop-down lists where needed. These spreadsheets then monitor each row of data for things like due dates, action dates, opportunities, change in status, etc.
- CRM solutions.
- Project management and process trackers.
- Task monitors.
- Compliance checkers.
- HR solutions.
- Drop down lists, dynamic or intuitive when possible.
- Conditional formatting to highlight missing or obviously incorrect data.
- Formulated cells to track things like tasks, due dates, status changes, warnings, and alerts.
- Countdowns like days to action or days since action.
- Automatic status updates, updating status based on objective achieved.
- The Document Creator
- The Lookup & Report
- The Dashboard
This is becoming increasingly popular, as it simply uses data exported from somewhere else to report on it. So, any programme, website, social media account, CRM, etc, that you can export CSV data from, can then be further analysed to your custom requirements.
- Social Media Reporting.
- CRM Analysis.
- Trend spotting.
- Google Analytics Reports.
- Financial Analysis.
- Data lookups and resorts (to combat layout changes).
- Data checks and balances (to find faulty data).
- Clearly displayed ‘used’ data so you can spot issues.
- Conditional formatting to alert you to potential problems.
- Flexibility to state what data to use.
- The Data Manipulator
- The Lookup & Report
- The Dashboard
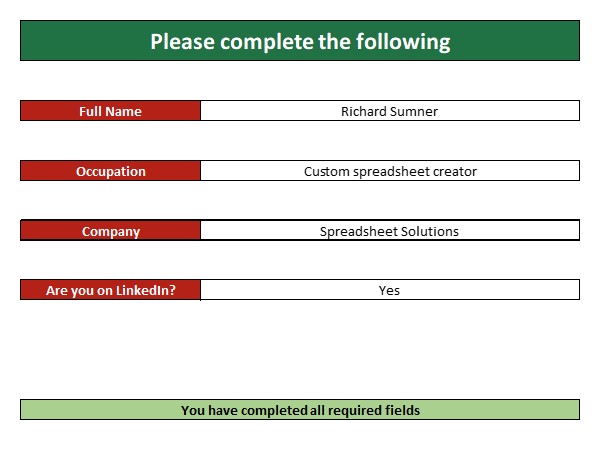
This is where users complete a ‘form’ type spreadsheet, where it not only helps them to know what to complete, but also produces an immediate result once completed.
- Tests and Quizzes.
- Questionnaires or Surveys.
- Product or Service Finders.
- Data Collection.
- Compliance Monitors.
- Cell colour changes depending on requirements. Red for incorrect data, green for complete, yellow for required, blue for optional, or grey if not required.
- An ‘overall progress’ bar, showing the user how far they are through the process.
- Reports that only complete once all data is entered correctly.
- Immediate reports or analysis.
- Potential data export for the collected data (if required).
- The Calculator
- The Lookup & Report
- The Dashboard
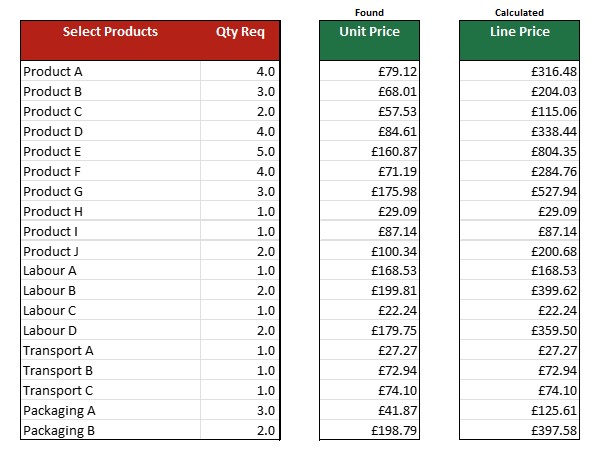
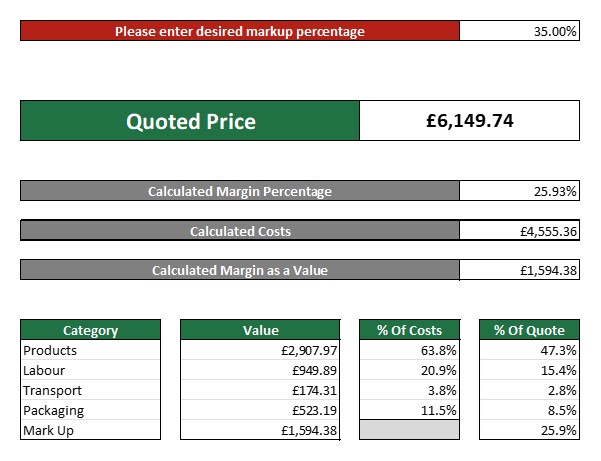
These are primarily used for price calculators for products or services. They can be for individual projects or clients, or it can be used to store all the quotes done for all clients. It all depends on the requirements and the volume of data. We do many of these kinds of spreadsheets.
- Quote Generators.
- Price Calculators.
- Price Comparisons.
- Service Specifiers.
- Quote Trackers.
- If all quotes are in one place, these can even track quotes with regards to conversion rates.
- Reporting, price breakdowns, and minimum requirement alerts can be added.
- We could even create the quote which populates, and can be saved as a PDF.
- We can include reasonable checks and balances to make sure it’s completed correctly.
- Spreadsheets like this help to eliminate careless errors and missed selections.
- The Interactive Solution
- The Lookup & Report
- The Dashboard
- The Document Creator
5. The Document Creator
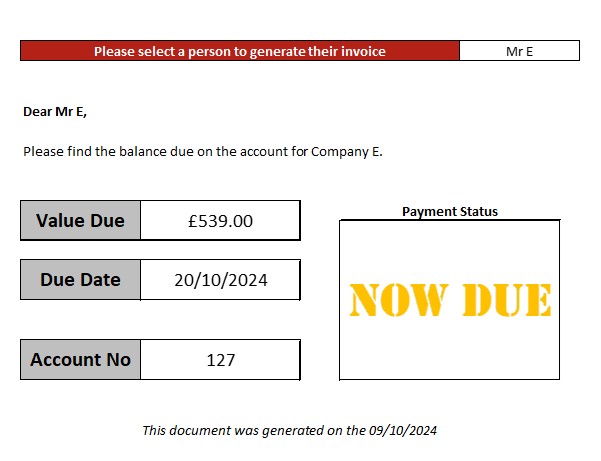
This is where we use Excel to create Word-like documents which can be saved as a PDF. The benefit of doing this means that the document can be repopulated with different information on demand, while keeping the same layout.
- Quote & Invoices.
- Progress Reports.
- Compliance Certificates.
- Results & Accomplishments.
- Letters & Documents.
- One template, where you select which job, client, quote, invoice, project, etc to include, and the document populates accordingly from the available data.
- We’ve used ‘code substitution’ where you can type up a text box using codes, that is then replaced with relevant data. Like “[Price]” that is then replaced with the relevant price for the selected client.
- Neat, tidy and organised.
- Only one template that repopulates, so no need for multiple documents.
- Section inclusion and colour changes based on selected data.
- The Calculator
- The Monitor of Entered Data
- The Lookup & Report
- The Dashboard
6. The Lookup & Report
This is usually linked to other spreadsheets, where data is collected. That data can then automatically feed into a live report. So, as the data is updated, the desired report is ready. This means that the reports are ready when you are, and you don’t need to ‘run’ them.
- Management Reports.
- Progress Reports.
- CRM Reports.
- Project Status Reports.
- Staff or Compliance Reports.
- We can include filters, so you can see the same report for an individual staff or all staff combined for example.
- These filters allow for almost endless reporting options.
- Custom reports with charts, tables, graphs, RAG alerts, and more. All which update as the data changes.
- These are usually PDF-friendly, so can be saved as a PDF as needed.
- These reports can combine various sets of data on the same spreadsheet.
- The Data Dump & Analyse
- The Monitor of Entered Data
- The Interactive Solution
- The Calculator
- The Lookup & Report
7. The Data Manipulator
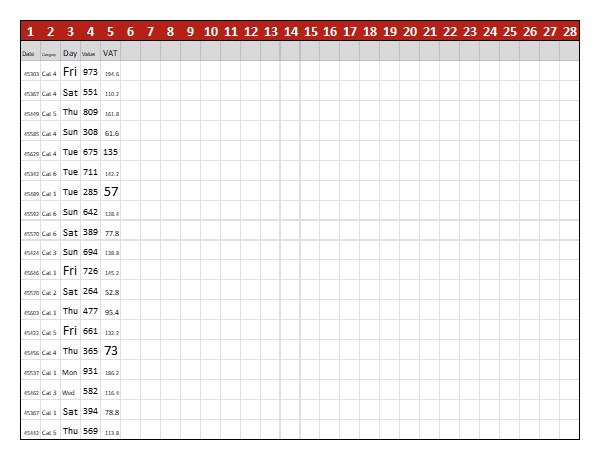
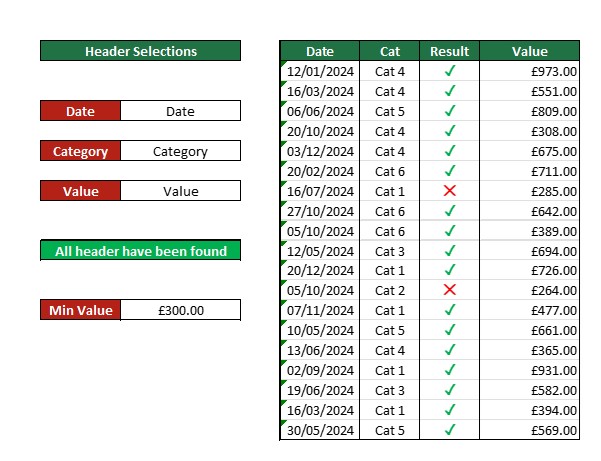
This is becoming increasingly popular in a ‘disjointed’ world. These kinds of spreadsheets do some heavy lifting while not looking particularly flashy. They are usually used to receive one data set from one source, and then to perform some checks, balances, re-arranging of data, etc, which then exports data back to the original source or a new target.
- Restructure of Data.
- Removal or Addition of Relevant Data.
- Flagging Alerts or Incorrect Data.
- Data Transfer from System to System.
- Data Conversion.
- These spreadsheets are usually quite large (file size wise) as they do a lot of checks.
- We create the required cells so that you can edit criteria such as text or values to look for.
- We can create fixed or dynamic export options.
- We have header selection to allow for raw data changes.
- Alerts for missing or obviously incorrect data.
- The Data Dump & Analyse
- The Lookup & Report
8. The Dashboard
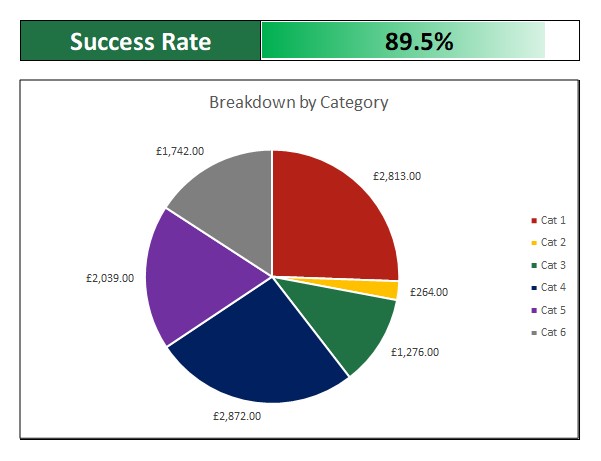
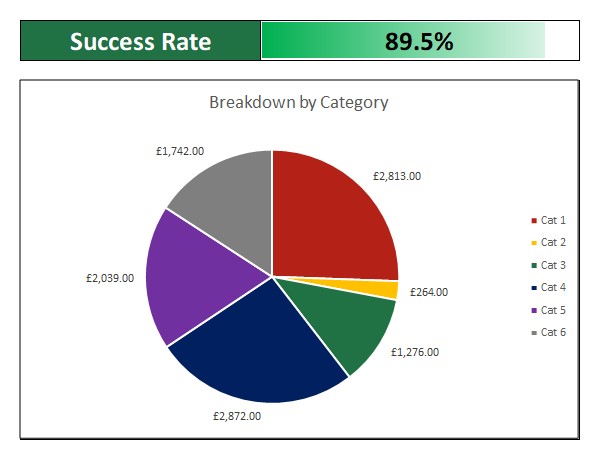
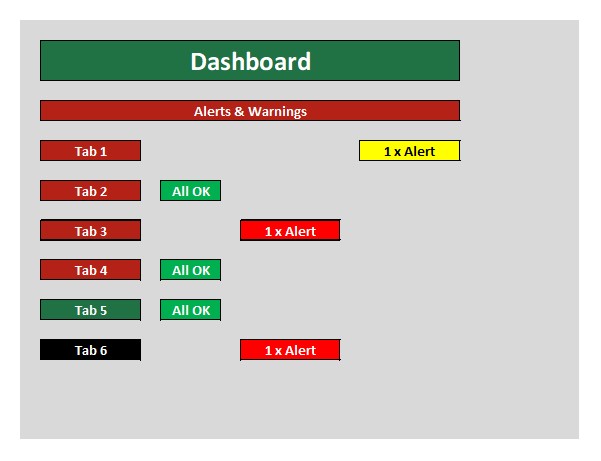
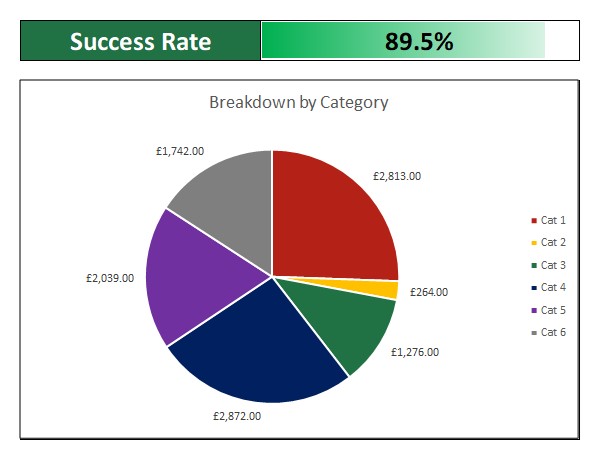
There is usually a dashboard on almost every spreadsheet we make. If there is data involved in any way, there is usually stuff to report on. The idea of a dashboard is to give the user an overview of the data. Not in detail like the report, but high end reporting that fits on one screen.
- Alerts to Missing or Incorrect Data.
- RAG Alerts.
- Trend Overviews.
- Important Totals and Figures.
- Category Breakdowns.
- Clear high-end reporting, which shows what needs your attention on one screen. This usually goes with the report, which can be used to get more information.
- We usually break dashboards into 4 sections, but this is not a rule.
- Sections of the dashboard could be dynamic. So, you could have one section which shows an overview for a member of staff, where you can select the person to show.
- Space on a dashboard is usually at a premium, so we try and make this as effective as possible in giving you the overview you need.
- Automatically updates live with your data.
- The Data Dump & Analyse
- The Monitor of Entered Data
- The Calculator
- The Lookup & Report
- The Data Manipulator

