SOCIAL MEDIA ANALYSIS
Are you looking to monitor your social media and marketing success?
We have a FREE spreadsheet to help you to monitor your marketing campaign success.
Why use this spreadsheet
- Plan social media content
- Monitor impressions and engagement
- Identify clicks to your website
- Discover campaign strengths
- View Google Analytics traffic
- Overall marketing dashboard
Version Number
1.002
This will only work with Excel
Want to unlock bonus content?
Need some help using this spreadsheet?
Demo videos and instructions
Introduction
Intro & Setup
This is the first tab on the spreadsheet, nothing too exciting, but it does allow you to state what kind of data you’re using for each of the platforms, and it lets you set the warning times to schedule posts on each platform.
Campaigns
This is where you can list up to 20 campaigns. Whether you do campaigns for certain periods of the year, or campaigns that run year long are up to you. Name your campaigns, which will then be available for selection on the platform tabs, and see the figures update as you proceed.
Data Input
This is the tab where you can ‘import’ all of the social media analytics figures that you export from the relevant platforms. Simply paste the values of the data here, copy and paste the new values on the relevant platform tab, and then clear this data ready for the next one. You even have some choice as to what data to use for your reports.
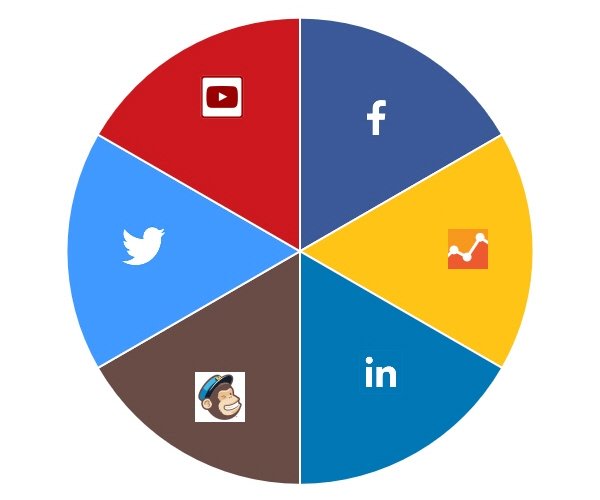
Platforms
There are 5 tabs for various platforms here. Facebook, LinkedIn, Twitter, YouTube, and Newsletter. The Facebook and LinkedIn tabs are for business pages, and the newsletter one is made for Mailchimp, but others can be used too. You can plan your posts, assign unique links to each post, and then mark them off once scheduled.The imported analytics data and Google Analytics data combine with this data to produce the reports.
Daily GA
If you want to see how your website traffic is doing, you can import that data too, to add this useful graph to the report.
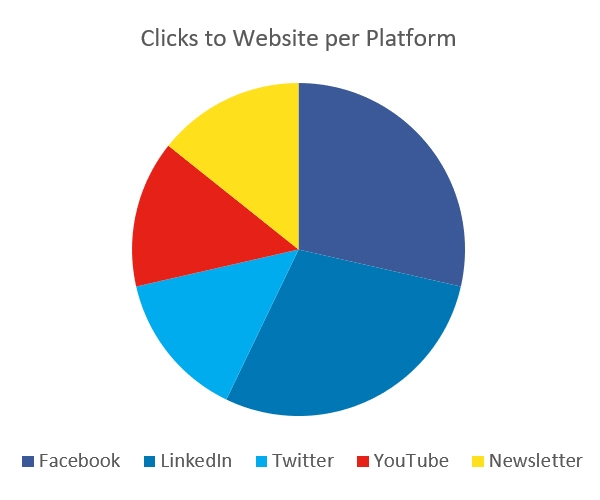
Content GA
This is the Google Analytics data that has the relevant query strings that you have used in your marketing posts. Once this data is added to the spreadsheet, you can see which posts have had the most clicks to your website, thus showing you wish campaigns have had the most success in generating website traffic.
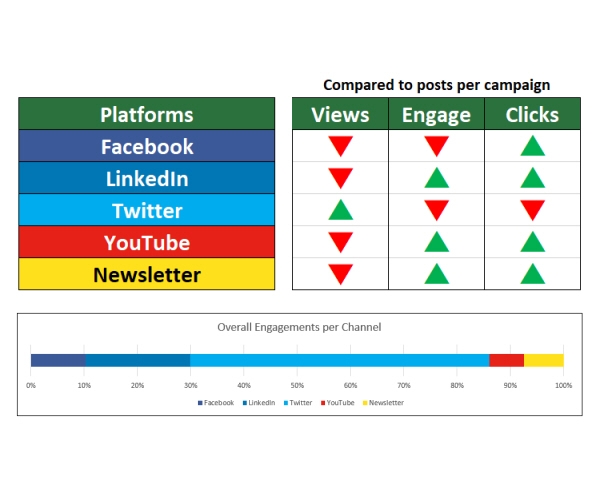
Reports
These two reports are almost 100% automated (just a few selections for you if you wish) and are generated from the data on the other tabs. One report shows you what you have scheduled for each campaign and month, as well as any potential warnings with the data. The other report gives you a detailed summary of how each campaign has performed in 3 areas. Impressions (eyes on content), Engagement (people liking, commenting on, or clicking on your content), and clicks back to your website (probably the most important action).
Arrange a Zoom training hour
If you use this form to send us your email address or contact number, we will get in touch to arrange an hour long Zoom (or Skype) meeting in order to explain to you how to utilise this spreadsheet. We charge £60 for this meeting.
Complete this form to get in touch
Contact us about anything else