Management Dashboards – Traffic Lights for Your Business
No matter what type of business you run, and how big or small it is, we all have one thing in common. We need to know how they have performed, and where we need to make changes. This isn’t just about the overall performance of the business, it could be broken down into departments or aspects such as staff performance, sales trends, delivery performance, client satisfaction, to name a few. Knowing how we have performed, gives us the valuable information to make any decisions regarding change. If you monitor two marketing campaigns, and one drastically outperforms the other, which one will you use as inspiration for the next campaign. Knowing exactly what has happened helps us to take the correct actions to implement positive change.
This is why management dashboards are so useful. They show you what you need to know, in as simple a way as possible.
What is a business dashboard?
Dashboards often provide at-a-glance views of KPIs (key performance indicators) relevant to a particular objective or business process. I think that says it all. A one-page report showing graphs, charts, and traffic light colours, to indicate how the business has performed in any objective. What have our sales trends been like? What profit have we made? Which staff have under-performed? How many of our projects were finished on time? How many clients have joined or left? How has our manufacturing process performed? All these questions, and many more, can be answered with a simple graph or illustration. These are extremely useful tools to have when you’re having a management meeting, trying to decide what actions to take within the business.
How do you get a business dashboard?
Most of the spreadsheets I get asked to do are either business dashboards, or at least have a business dashboard within them. If I can understand what you want the information on the dashboard to show you, and you have all the data to produce that information, I can make you a bespoke dashboard using Excel. Why Excel? Well not only is it my tool of choice, but it is extremely useful when it comes to dashboards. Taking data and producing reports is what Excel and I do well. If you know what you want monitored, and you have the data to produce the report, there is only one more decision to make.
How do we get the data into the spreadsheet?
There are usually two ways (if we’re making a macro-free spreadsheet). You can either copy the data from an external source (such as a CSV export from your accounting or CRM software), and paste the data into the spreadsheet, or you can manually enter it. If you choose to paste the data, then I will lay out the data page to suit your batch of data. This means that when you paste it in, the spreadsheet knows exactly what data is there, and it can do the calculations. If you choose to manually enter it, then there may be details that you need presented as you progress, rather than just seeing the finished report at the end. Many people use spreadsheets as their business software, so not only does it produce the automated dashboard, but it can also help you during the process.
Are you interested in getting a business dashboard?
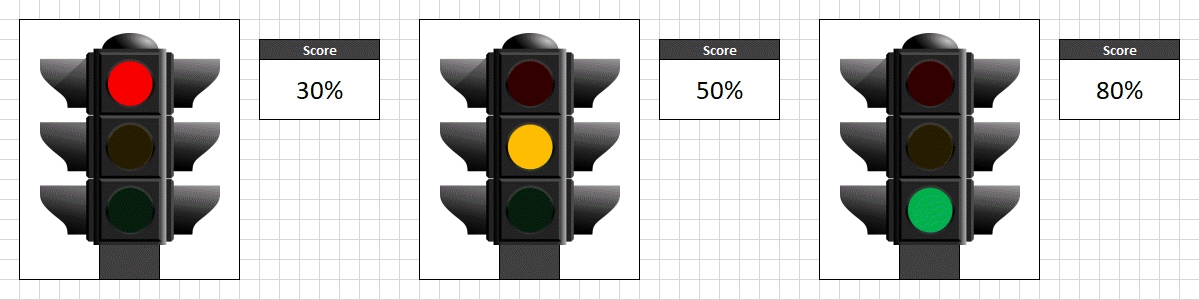
If you are, please don’t hesitate to get in touch. Management dashboards are becoming extremely popular, and I would like to make this option open to everyone, not just large businesses. It really is like having a traffic light for your business. On that note, I’m often asked to do traffic light style reports, but I’ve never been asked to make it look like an actual traffic light. I thought I’d make a traffic light in a spreadsheet, just to illustrate my point, which you saw at the top of this article. Here it is again.
Recent Comments