Forget Big Data, Understand Your Little Data
There seems to be a trend at the moment about ‘big data’, but do you actually know what that is? Why is it such a trend, and is there anything that you could be doing about it? Take a look below, as I will try to explain what big data is, and why it is so important. I’ll also show you why ‘little data’ is just as important, and why it is vital for you to understand yours.
What is big data?
Big data is very simply large quantities of data which have been acquired, which is then analysed to spot trends and patterns, mainly to do with human behaviour. Facebook and Google are prime examples of this. They don’t charge us to use their products, yet they are rolling in money. Where do they get it from? Information. They gather information, and then sell it on to other businesses, or even small businesses, in order for us to reach our desired clients. They know all sorts of things about us, as they have all the data, and they have super computers analysing all of this data. When data is properly analysed it produces information, which is vital and very valuable. So, what can you learn from this when it comes to your business? You may not have big data, but you have ‘little data’, and this is also valuable if analysed properly.
What is little data?
It is the same concept as above, but just smaller batches of data. Facebook may be using billions of lines of data, but you may only have hundreds. That doesn’t make the data any less valuable, it just means that you have less of it. Think about your business and how much data you have, and then how much data you could have, if you just took the time to collect it. Now, imagine what that data could show you if it were properly analysed.
What kind of data can I analyse?
Absolutely anything. All you need is the raw data, which either can come from an existing programme, or can be collected manually. What data you wish to analyse is completely up to you. All of our businesses are different, and we all need to know different things, so any data can be collected and analysed.
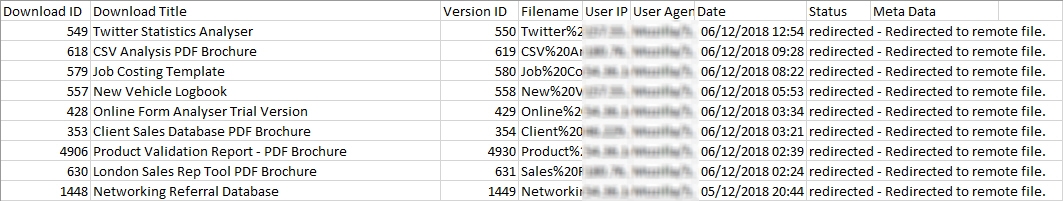
Just to give you an example of what I mean, I have taken one aspect of one part of my business, and analysed the data. On this website there are various items which you can download. These range from brochures to products and free spreadsheets. I have a list of all my downloads on the back end of the website, and I can export a list of all the downloads since I last cleared the list. That is the raw data or, in this case, small data. It is by no means complicated, but it is not really understandable in its raw state. Here are a few rows of data, as it is exported.
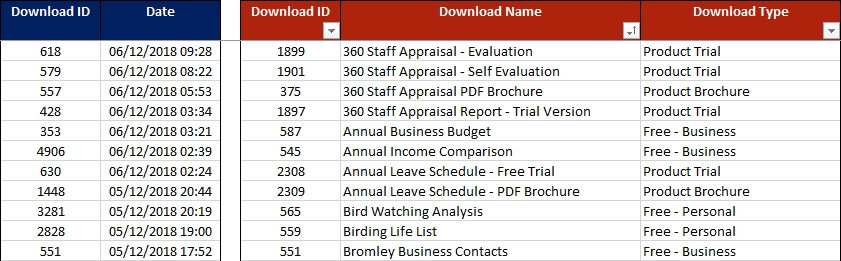
Now I need to understand that raw data, in order to know what is happening with the downloads. I take that data, remove the unused columns, so I am left with only two columns. The date and the download ID. Why only two columns? Because that is all I need, to know what I want to know. I only use the data I need. If I needed to know more, I’d use the data. I then paste that data into my spreadsheet, where I have a list of the download IDs, download names, and the category type of download. This data remains constant, so I just add new downloads in as necessary, and just update the raw data each month.
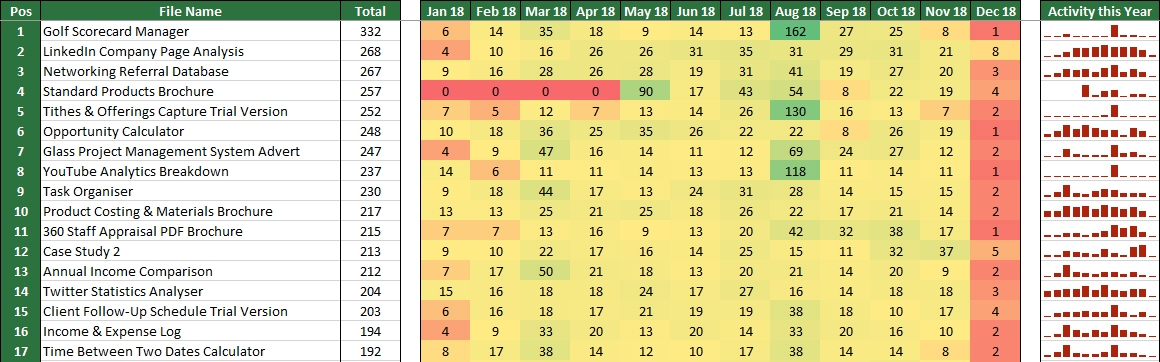
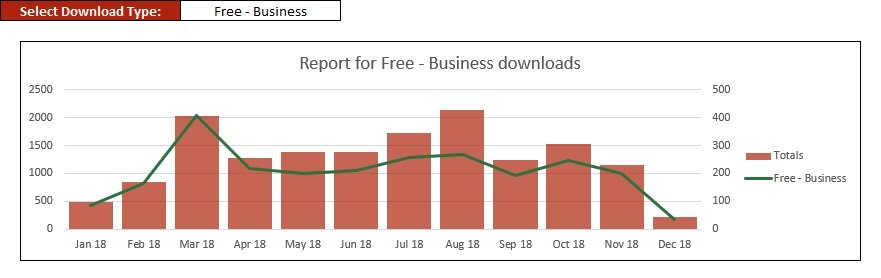
The spreadsheet then automatically updates the rest of the workbook, with the new raw data, and produces various results.The first of which is a list of the downloads, in order of popularity, showing the figures by month over a 12 month period. This way I can immediately spot which downloads are more popular, and their download rates over the last 12 months. I can see if the download rates of any have slowed down or sped up, and I can see if there were any particularly high or low months with regards to download activity. What makes this data even more useful, is that it is colour coded to easily spot trends and changes. But this is only the beginning.
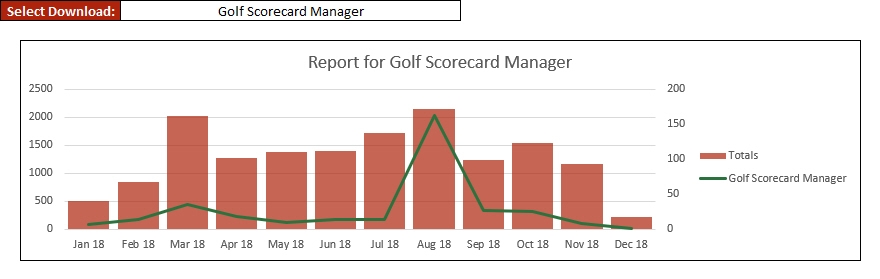
I then have further reports in graph form, showing me the overall download rate per month, as well as my selected download. So for example, if I had a surge in a specific download in a month, did that reflect the overall download rate, or was it in spite of it? I can simply select the required download which I want to view, and see the graph change accordingly. This means that I can really drill down and find out whatever I need to.
What about the types of downloads? As you recall, I categorised each download into a type, so I can also see how each type of download compared to the overall download rate. This will help me to see which type of download was more popular each month. I can then ask myself why that was the case, which will help me to decide what to do more of. When you plan the direction of your business, it is vital to know what has happened before, and why.
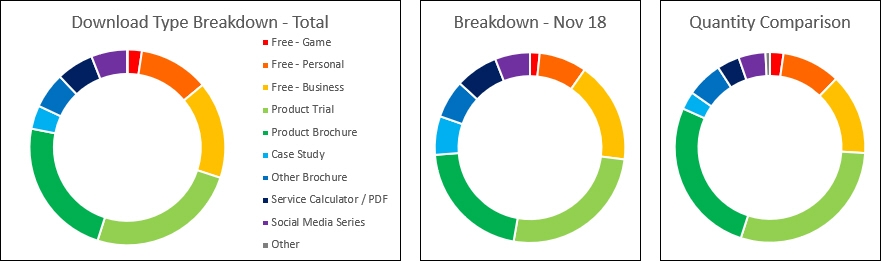
Then I wanted to know how the download count of each download type compared to the number of each type. For example, if 5% of the available downloads were in the Social Media Series, I would expect that series to account for 5% of the downloads. I would like to see this per month and overall for the year, so I can see if any particular type was over or under performing based on the number of downloads available. No problem, the data tells me all I need to work this out, so I created these graphs to show me exactly what was going on. From left to right, the total breakdown, the breakdown for the selected month, and then what the breakdown should be based on the number of downloads in each category.
So there you have it. A very simple example of how a little bit of data can show you so much information. Information that is not only useful, but often vital when you’re planning your next step. You may not sell this information, like Facebook does (and have gotten into trouble for doing), but it is vital to the future of your own business.
How can I do this?
Simple, you need to start by getting the data. If you have a handy export option from a website, application or software programme, then that is a quick win. You can often just export data, as I have done in the example. If not, you may need to collect the data. Why not make the collection of specific data part of your process? When you get a new client, simply ask them a question or two and make a note of their answers. You could even send out a questionnaire or have some questions on your website. However you collect the data, once you have it, you can use it.
Now, fortunately for us, we don’t need super computers to analyse little data. Your laptop or desktop and a well constructed spreadsheet can do the job for you. If you know your way around Excel, then I’ll leave that with you to get on with. If you would like someone to make you a professional spreadsheet, to do this process with as minimal effort from you as possible, then you can always get in touch with us. That is what we do.
Happy little data analysing, and all the best with your business.
Edit: If you’d like to purchase the spreadsheet used in this example, you can do so here.
Richard
Recent Comments