You’ve probably heard the saying that you can’t keep on doing the same thing, and expect different results. The big problem is understanding what works, and what doesn’t. We’re overwhelmed with all sorts of blog posts like this one, telling us which marketing platforms are the best. Most are written by people who are trying to sell you a marketing solution, so are probably shown from their point of view.
Before you take my findings as fact, or change your marketing habits to suit, please just remember than this post is more about you understanding your data than it is about me telling you about marketing. I am not a marketing expert, I create bespoke spreadsheets to analyse data such as this. This is what I have found about my business, and I would very much like to help you understand about yours. This doesn’t just apply to marketing, but all areas of your business.
Anyhow, here we go.
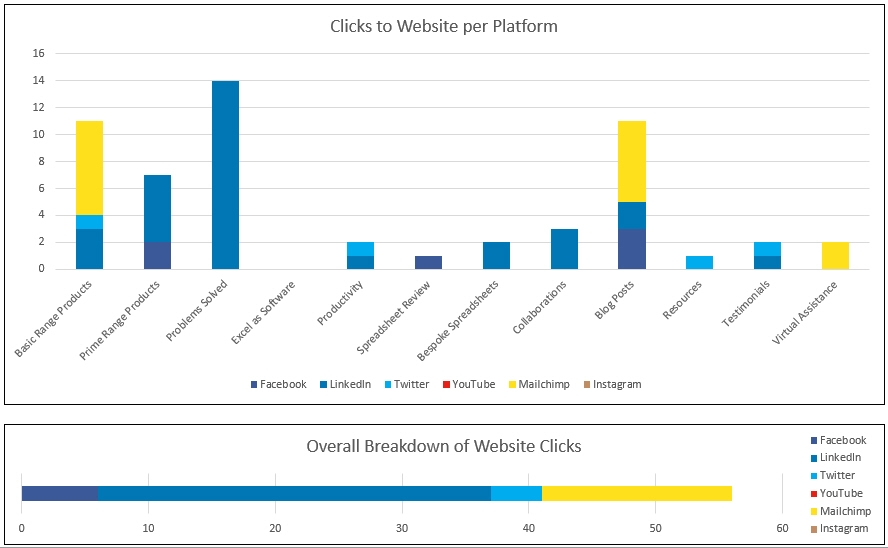
As you can see, I have broken all my posts into campaigns, as I wanted to see which campaigns were working better on what platform. How do I gauge the success of a campaign? I simply look at the clicks to the website, the more clicks, the more successful I deem it. Here we can see that some campaigns seemed to have worked better on some platforms, and some were more successful overall. This helps me to decide which campaigns to continue in the new year, and which ones to change. It also makes me consider different campaigns on different platforms.
Just to be clear, in the case of Facebook and LinkedIn, this data is only for posts, posted via the business pages. It doesn’t include my personal interactions in groups and on the platforms. That also brings in business.
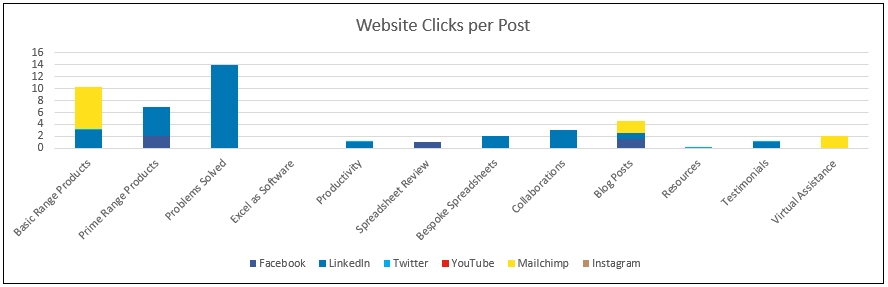
So there you have it. My marketing results from 3 months. It was pretty much how I expected it, based on how I use the different platforms. The one thing that I found particularly useful was the ‘clicks per post’ breakdown of the different campaigns. That gives me a good idea of what campaigns to kill, and what else I should try in the future.
The objective of this post is not to tell you what platform you need to use, but to show you how important it is to understand your data. This is not just for marketing but just about everything in your business. Sales, products, staff performance, project success, process tracking, and various other aspects of business, all produce data. If you have access to the data, we make spreadsheets to analyse that data and give you the information that YOU need to make the right changes. If that sounds like something you need, please get in touch, we’d love to talk to you about it.
Recent Comments